
Dealmaker’s Digest: A Top 10 Bulletin – January 2025 – Corporate and Company Law

In Dealmaker’s Digest, read the top 10 latest developments
in global transactions. We offer insights into M&A activity
across industries and borders. To receive our M&A thought
leadership, please join our mailing list.
Key Takeaways
- Annual global M&A activity in 2024
rebounded significantly from 2023’s sluggish deal landscape.
Aggregate value of transactions ($100m+) increased 14% across all
buyer types, with sponsor-led deals jumping 36%
year-over-year. - Crossborder transactions played a key role for
dealmakers in 2024. Inbound U.S. transactions, totaling nearly
$350B, jumped 21% from 2023, while outbound U.S. activity rose 18%
(surpassing $430B for the year). - More mega-deals were struck in 2024 compared
with 2023; more than 25 U.S. transactions exceeded $10B in value, a
23% increase.
Global M&A Activity Update
1. Deal Value Trends
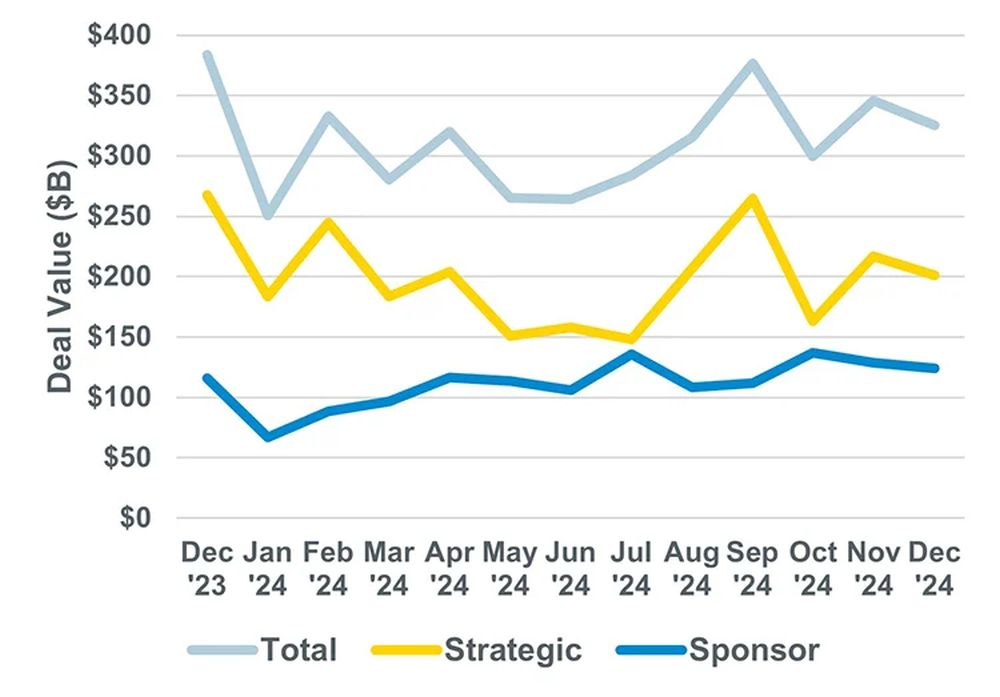
 Aggregate global monthly deal
value1 decreased moderately in December, down about $20
billion (6%) from November. Total monthly deal value decreased 15%
year-over-year.
Transactions involving strategic
buyers in December also declined in value (7%) from November.
Strategic deal value in December dropped 25% year-over-year.
 Financial, or sponsor, buyer
transactions in December held steady, decreasing only 4% from
November, rounding out a comparably steady Q4 for sponsor
acquisitions. Sponsor buyer deal value increased 7%
year-over-year.
2. Deal Count Trends
Global deal count held steady
from November to December, ticking up 4%, and rounded out the most
active quarter by count for the year. Monthly deal count increased
16% year-over-year.
 Strategic buyer deal count in
December increased moderately, up 6% from November and 11%
year-over-year.
Sponsor buyer deal count in
December remained steady month-over-month, decreasing just 1% from
November. However, sponsor deal count rose dramatically (28%)
year-over-year.
3. Annual Global M&A Activity (Transactions
$100M+)
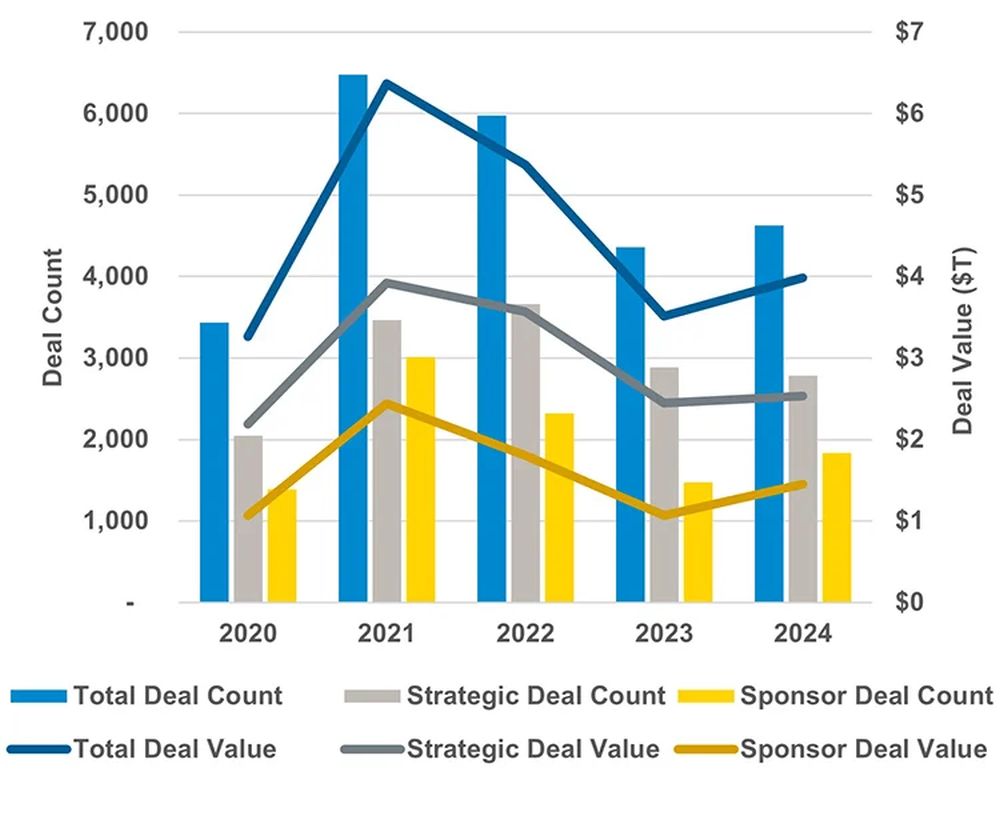
- M&A activity increased in 2024 by nearly all metrics as
dealmakers seized opportunities amid more favorable transacting
conditions, including consecutive interest rate cuts and tampered
inflation. - Aggregate value of transactions $100m+ increased significantly
in 2024 compared with 2023, up 14% across all buyer types.
Aggregate value of sponsor buyer deals led the increase with a 36%
jump, while strategic acquisitions held steady, up just 4%. - The number of transactions valued at $100 million or greater
increased 6% globally in 2024 vs 2023. Sponsor acquisitions jumped
24% by count, while acquisitions by strategic buyers held steady
(declining a marginal 3%). - The uptick in 2024 M&A activity was a noticeable rebound
following consecutive declines in dealmaking since 2021’s $6.4
trillion record.
4. Annual U.S. Crossborder Activity
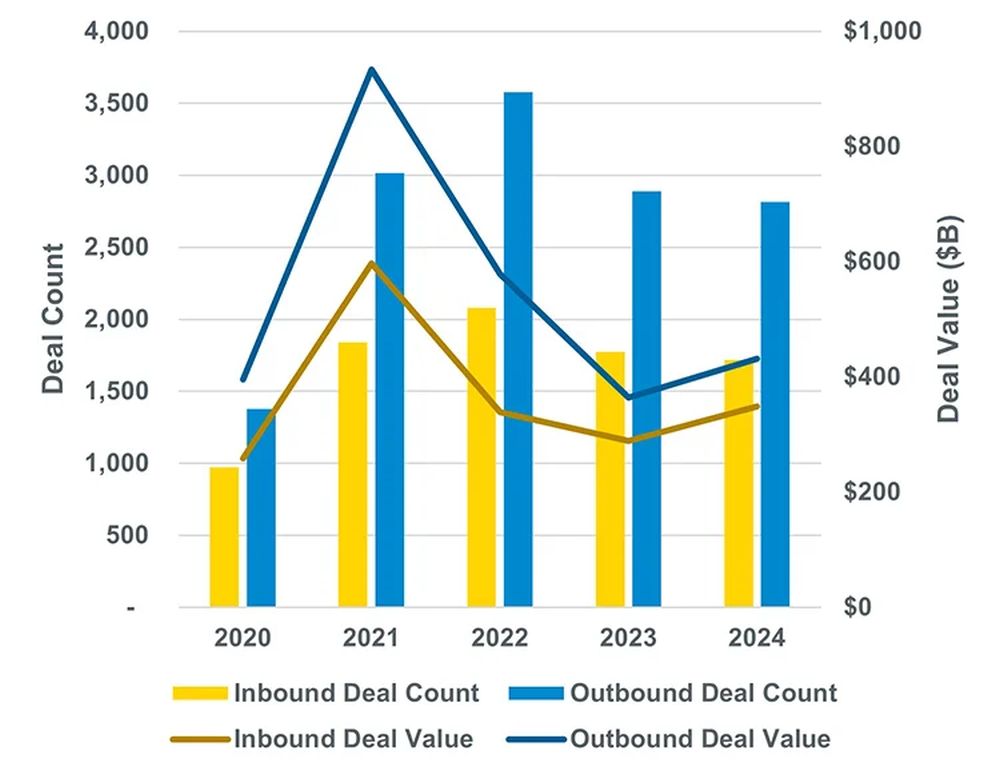
- Inbound U.S. activity in 2024 jumped 21% by deal value from
2023 and held steady by deal count (declining just 3%). The value
of U.S. companies acquired by non-U.S. buyers in 2024 totaled
nearly $350 billion. - Outbound activity in 2024 jumped 18% by deal value from 2023
and remained stable by deal count, declining just 3%. The value of
non-U.S. companies acquired by U.S. buyers in 2024 totaled over
$430 billion. - Canada-based acquirers drove the most inbound transactions in
2024 (287), followed closely by the UK (278). Japan-based buyers
took third at 147 transactions. - U.S. acquirers most frequently looked to targets in the UK
during 2024 (572), with Canada (382) and Germany (198) rounding out
the top three ex-U.S. target countries.
Active M&A Industries (U.S. Targets)
5. By Deal Count
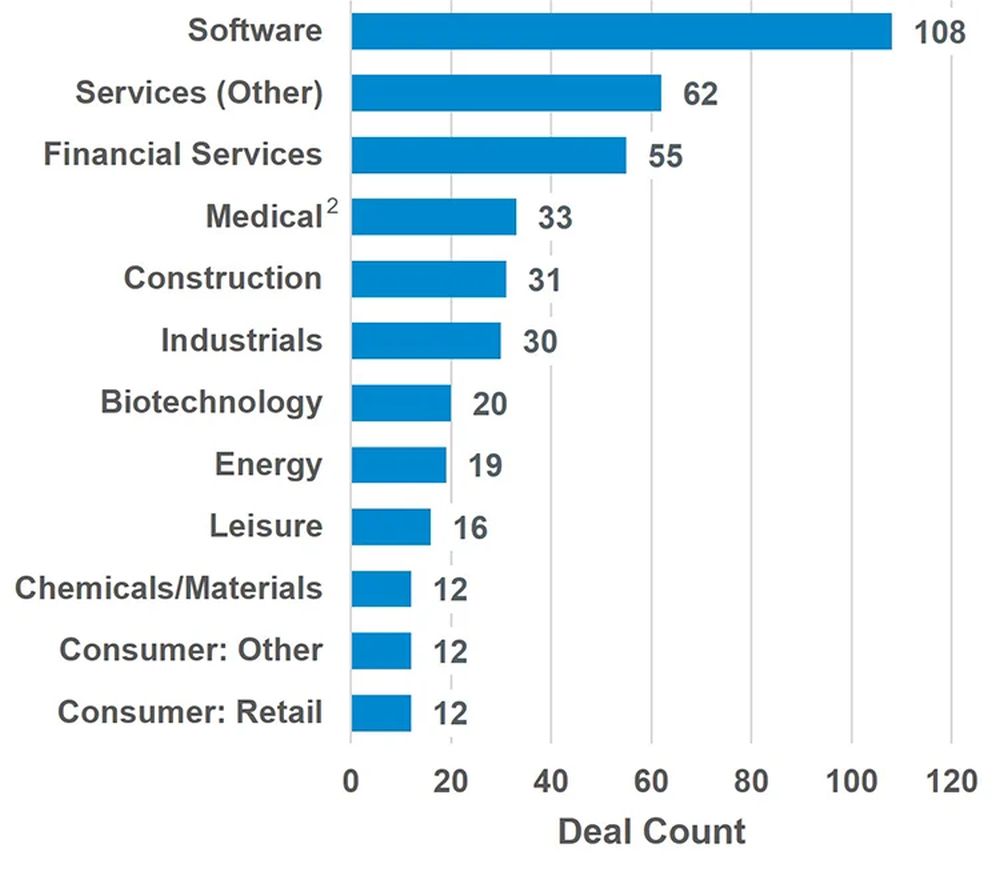
- The software industry once again topped the list of U.S.
M&A activity by deal count in December, continuing its streak
as the leading industry by volume and rounding out a full year at
number one. - Services industries also remained active, with financial
services and other professional services again rounding out the top
three sectors in December by deal count.
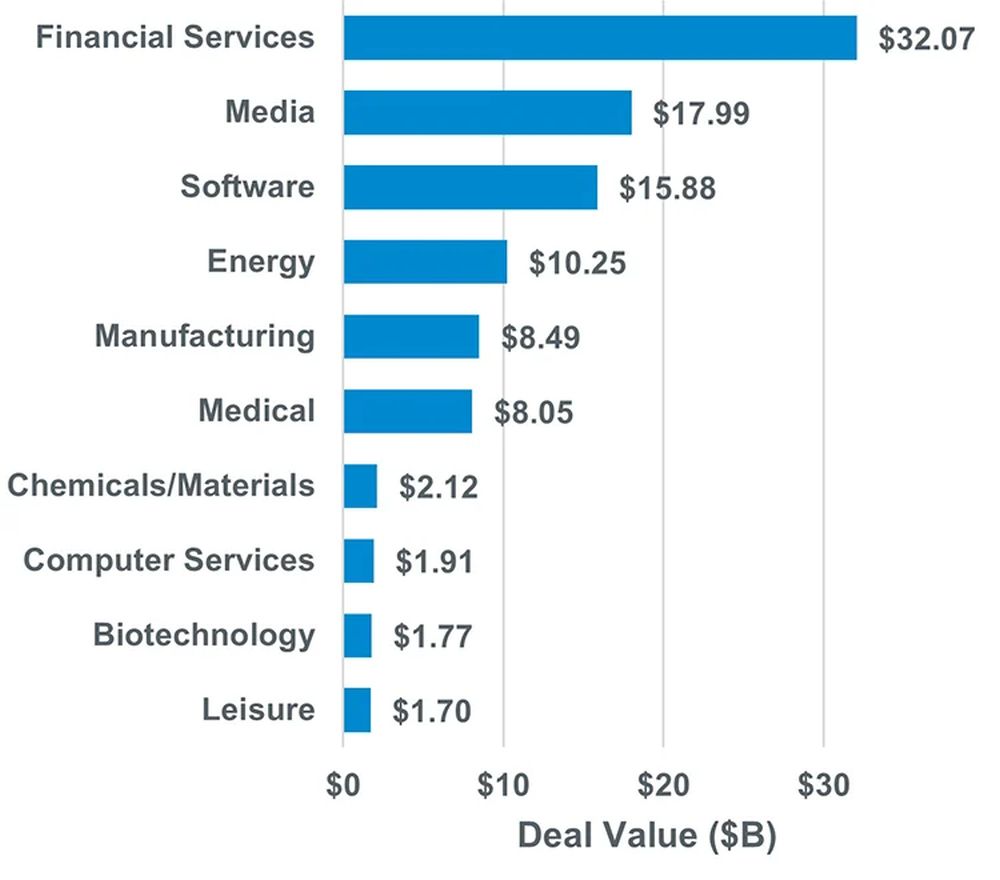
6. By Deal Value
- Financial services was the leading U.S. industry by deal value
in December, with two of the five largest deals of the month,
together totaling more than $25 billion in deal value. - Media was the second most active by deal value in December,
bolstered by Omnicom’s blockbuster acquisition of Interpublic.
Software targets were the third most active, at just over $15
billion in deal value.
December Blockbuster Deals
7. Largest U.S. Media Deal
Omnicom Group has agreed to acquire The
Interpublic Group of Companies, Inc. in an all-stock
transaction valued at approximately $13.75
billion.
8. Largest U.S. Asset Management Deal
BlackRock, Inc. has agreed to
acquire HPS Investment Partners, LLC in an
all-stock transaction valued at approximately $12
billion.
9. Selected Annual Highlights
More than 35 transactions exceeding $10 billion were announced
globally during the year, demonstrative of the comparably favorable
market conditions following tempered activity in 2023.
Transformative deals were struck in a variety of sectors, including
those highlighted below.
| Industry | Target | Buyer | Deal Value |
|---|---|---|---|
| Consumer Goods | Kellanova | Mars, Incorporated | $36 B |
| Financial Services | Discover Financial Services | Capital One Financial Corporation | $35 B |
| Software | ANSYS, Inc. | Synopsys, Inc. | $34 B |
| Media | Paramount Global | Skydance Media and RedBird Capital Partners | $28 B |
| Energy | Endeavor Energy Resources, L.P. |
Diamondback Energy, Inc. | $28 B |
| Pharma | Catalent, Inc. | Novo Holdings A/S | $16 B |
10 .2024 M&A Activity Recap
A snapshot of 2024 metrics, and how they stack up against
2023.
| 2024 | 2023 | Δ% | |
|---|---|---|---|
| Global Deal Value | $3.91 T | $3.49 T | 🡅 12% |
| Global Deal Count | 43,101 | 42,546 | 🡅 1% |
| U.S. Deal Value | $1.77 T | $1.58 T | 🡅 12% |
| U.S. Deal Count | 11,412 | 11,695 | 🡇 2% |
| # of $10B+ Deals (U.S.) | 27 | 22 | 🡅 23% |
Footnotes
The content of this article is intended to provide a general
guide to the subject matter. Specialist advice should be sought
about your specific circumstances.
link