
Dealmaker’s Digest: A Top 10 Bulletin – August 2025 – Corporate and Company Law

In Dealmaker’s Digest, read the top 10 latest developments
in global transactions. We offer insights into M&A activity
across industries and borders. To receive our M&A thought
leadership, please join our mailing list.
Key Takeaways
- U.S. outbound deal value jumped to over $80
billion in July; the highest monthly value in over 3 years was
driven by megadeals in the software and pharmaceutical
sectors. - Aggregate global deal value in July increased
another 6% and exceeded $480 billion, while monthly deal count
dropped 13%. - Acquisitions in the software and transportation
sectors led U.S. M&A activity in July. - Earnouts: A market snapshot of this key
M&A mechanism.
Global M&A Activity Update
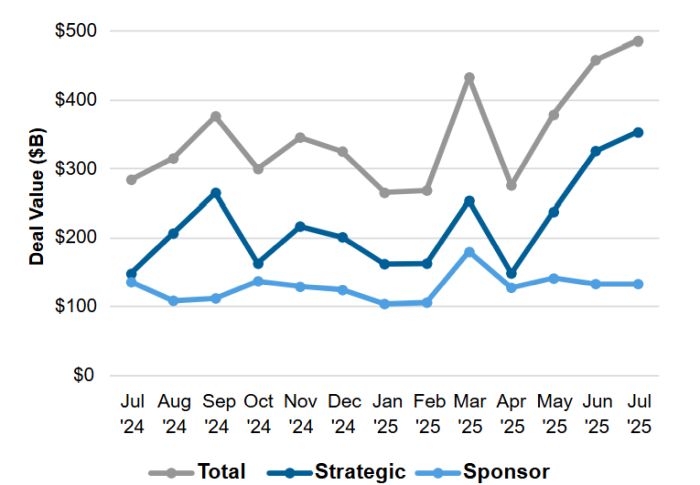
1 Deal Value Trends
Aggregate global monthly deal value1 in July exceeded
$480 billion, an increase of 6% from June and 71% year-over-year.
Union Pacific’s $71 billion proposed acquisition of Norfolk
Southern drove the highest monthly deal value in more than three
years.
Transactions involving strategic buyers in July exceeded $350
billion and continued Q2’s upswing in activity. Strategic buyer
deal value was up 8% month-over-month and 139% year-over-year.
Financial, or sponsor, buyer transactions held steady in July,
down by just $100 million. Year-over-year, sponsor buyer deal value
also held steady (-2%).
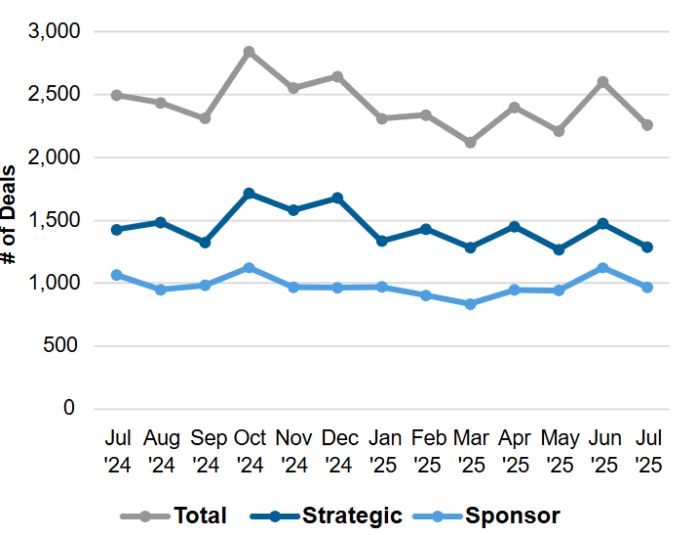
2. Deal Count Trends
Despite the upswing in monthly value, global deal count declined
13% in July and regressed toward the trailing twelve-month average
(~2300 deals). Year-over-year, deal count dropped 10%.
Strategic buyer deal count in July also declined 13%
month-over-month and 10% year-over-year.
Sponsor buyer deal count fell 14% from June and 9%
year-over-year.
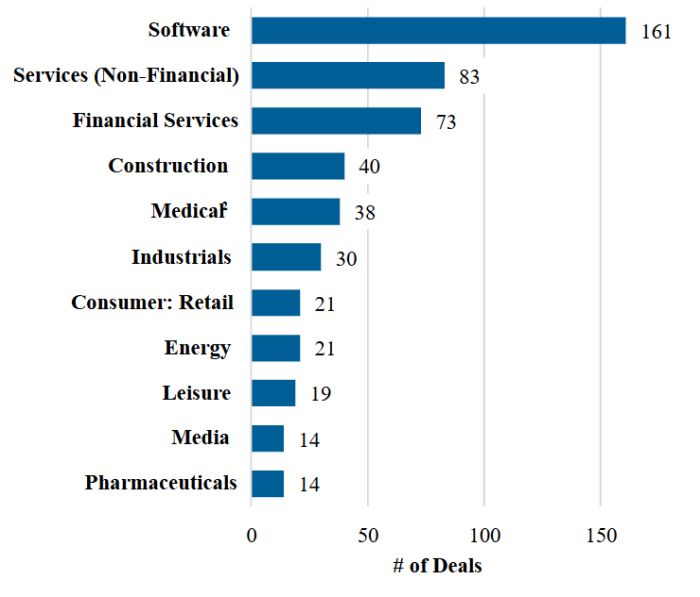
Active M&A Industries (U.S. Targets)
3 By Deal Count
- The software industry remained at the top for U.S. M&A
activity by deal count in July, continuing its streak as the
leading industry by volume. - Services industries remained active, rounding out the top three
sectors in July by deal count.
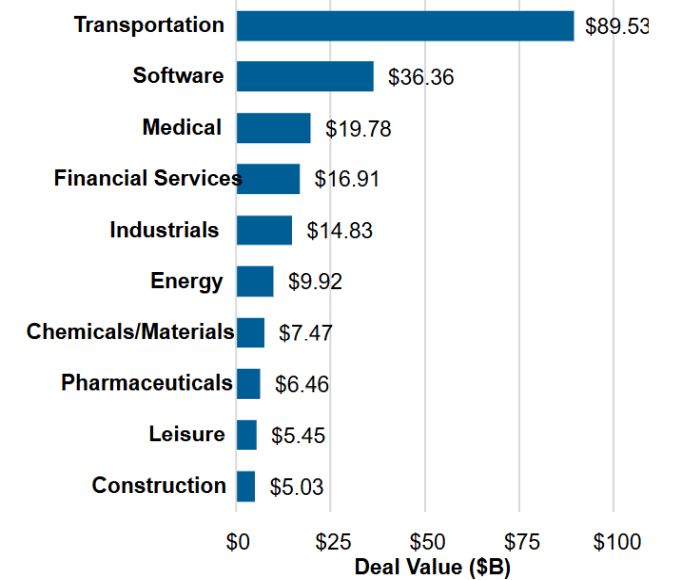
4 By Deal Value
- The transportation sector topped the charts by deal value in
July, driven by Union Pacific’s $71 billion announced merger
with Norfolk Southern. - The software industry was pushed to second place for most
active sector by deal value in July, followed by the medical
sector.
5 Global Blockbuster Deals
Largest Transportation Deal
- Union Pacific agreed to acquire
Norfolk Southern in a stock and cash transactions
with an equity value of approximately $71
billion.
Largest Software Deal
- Palo Alto Networks agreed to acquire
CyberArk in a stock and cash transaction with an
equity value of approximately $25 billion.
6 Inbound U.S. M&A Activity
- By deal value, inbound U.S. activity in July declined 10% from
June. Year-over-year, inbound deal value held roughly steady
(-4%). - By deal count, acquisitions of U.S. targets by non-U.S.
acquirers declined 7% in July. Year-over-year, inbound deal count
decreased 25%, likely the result of continuing political
uncertainty regarding foreign investment. - UK- and Canada-based acquirers undertook the largest number of
inbound transactions in July, with 15 and 12 deals, respectively.
India trailed behind with 7 deals.
7 Outbound U.S. M&A Activity
- By deal value, acquisitions of ex-U.S. targets by U.S. buyers
in July skyrocketed 219% from June to approximately $83 billion,
the highest recorded in over 3 years. Megadeals in the software and
pharmaceutical sectors drove the increase. Year-over-year, outbound
deal value was up 129%. - Despite the boom in deal value (caused by outsized
blockbusters), outbound deal count decreased 16% from June to July.
Year-over-year, outbound deal count declined 25%. - U.S. acquirers predominantly looked to targets in the UK in
July, with 29 transactions. Canada took second place with 15
transactions, and Australia took third with 9 deals.
Market Snapshot: Earnouts
Whether bridging stubborn valuation gaps, unlocking deals that
might otherwise stall, or assuring founders they can participate in
future upside, earnouts have become a defining feature of M&A
in recent years. Key earnout market insights are highlighted
below.
8 Earnout Usage
- Earnouts have gained prominence as a flexible solution to
valuation uncertainty, especially in sectors facing rapid change or
limited comps. They allow parties to bridge pricing gaps by tying a
portion of the purchase price to the achievement of post-closing
milestones, aligning incentives and enabling deals in challenging
environments. - In private-target North American deals (other than life
sciences transactions)3 in which Ropes & Gray
advised over the last 18 months, more than one-quarter included a
milestone payment or other earnout mechanic. - The noticeable post-2020 uptick (when 21% of comparable deals
utilized an earnout) illustrates the extent to which parties have
leveraged this mechanism to enable deals amid unsteady economic
markets.
9 Basis for Earnout
- Sales or revenue-based metrics have been the most frequently
utilized earnout triggers over the past 18 months, followed by
EBITDA or other earnings-based targets. - Other triggers that we observe include deal-specific
objectives, such as high-multiple exits, closing of add-on
acquisitions or technology-focused metrics (e.g., subscription
counts).
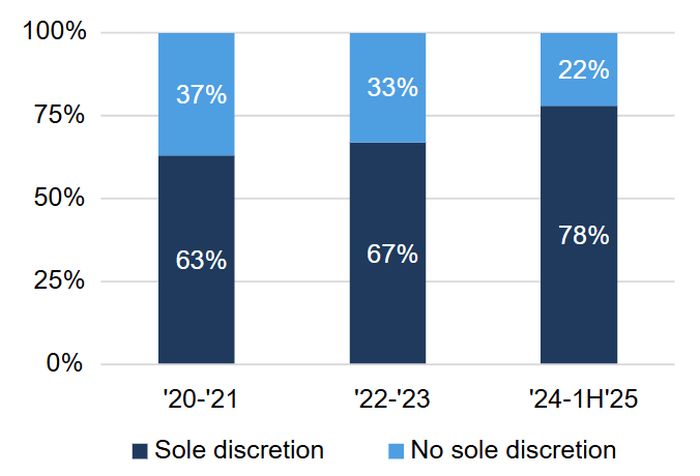
Standard of Operation for Businesses Subject to Earnout
- Where earnouts are utilized, covenants and other guardrails
regarding the standard of operation during the earnout period are
often heavily negotiated. - We have observed an increasing percentage of deals providing
buyers with sole discretion to operate post-closing, often coupled
with deal-specific or measurable obligations in lieu of
“ordinary course” covenants. This trend continues from
earlier years.
Footnotes
1. Unless otherwise noted, charts compiled using
Mergermarket data for July 2025 as of August 5, 2025. Aggregate
deal values by dollar amount are calculated from the subset of
deals with disclosed values.
2. Medical industry classification principally includes
medical devices/technology/services, excluding biotech and
pharmaceutical deals.
3. Transactions in the life sciences sector have been
excluded to better represent the prevalence of earnouts and related
standards across all industries. Life sciences transactions have
traditionally utilized earnouts or CVRs at higher rates and
incorporate tailored milestone events (such as regulatory approvals
or commercial viability standards); recent data suggests the use of
earnouts and CVRs outside of life sciences is
increasing.
The content of this article is intended to provide a general
guide to the subject matter. Specialist advice should be sought
about your specific circumstances.
link


